IncredibleCharts Pro 10.0

Free Incredible Charts provides access to charting tools and delayed data
3.8 
Rating
Your vote:
Latest version:
10.0.0 See all
Developer:
Screenshots
1 / 17
Awards (2)
Show all awards
Software Informer Editor Rating 4 Software Informer Virus Free award
Download
Free   7.9 MB

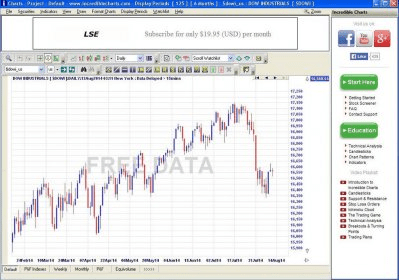
Incredible Charts is free, and provides access to charting tools and delayed data. The Trading Diary newsletters provide free weekly analysis of major stock markets, gold, crude oil, currencies, bond yields, interest rates & the economy. To use this app you need to create an account.

Editorial review:
Read a full review

Comments (7)

3.8
Rating
6 votes
5 stars
3
4 stars
1
3 stars
1
2 stars
0
1 stars
1
User

Your vote:

D
rating david
I have tried three times to download and use this program. Can't leave the register page. I give up.

Was it helpful?  yes(0) no(0) | Reply
G
Guest
I have used incredible chats for years. One of the biggest faults they have is the stock and index search. It is next to impossible. Try to find the US dollar index.

The next fault is that trend lines can not be transferred from one time frame to another.

Lastly, the fibs need to be put together with a couple of more choices on the fib extensions.

Don't expect any response when you email them for help.

Was it helpful?  yes(0) no(0) | Reply
G
Guest
The previous versions (before July 2014) worked fine. The latest one is total junk. They try to reinstall - repair forever. There must be a competition managed to hire their staff within I Charts. Or simply some morons started programming this tool. What a shame: it is even worse than the MS Win 8 upgrade as Windows at least works.

Was it helpful?  yes(0) no(0) | Reply

Related software

Forex Strategy Builder
Free
rating

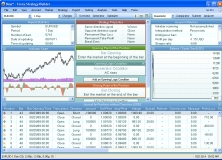
It is a platform for creating, testing and analyzing trading strategies.

PRO-RT COMMODITY
PRO-RT COMMODITY
rating

It is an add-on designed for the Amibroker Metastock charting platform

MCX NSE CHARTS
MCX NSE CHARTS
Free
rating

You can make complex chart analysis on various financial instruments.

Point & Figure Charts
rating

It is a program that allows you to create market technical indicator.

XTick Extreme
XTick Extreme
rating

It is a Forex charting application designed for technical analysis in real-time.

Related suggestions

Free stock market video download

Tags

Stock Analysis Find trends Market patterns Stocks indicators Chandle chart Chart analysis Bar charts Point & figure Chart Stock